Dashboards
Dashboards are grids of tiles — charts, KPI scorecards, tables and text — that you build without writing code. Open the list with Ctrl+5.
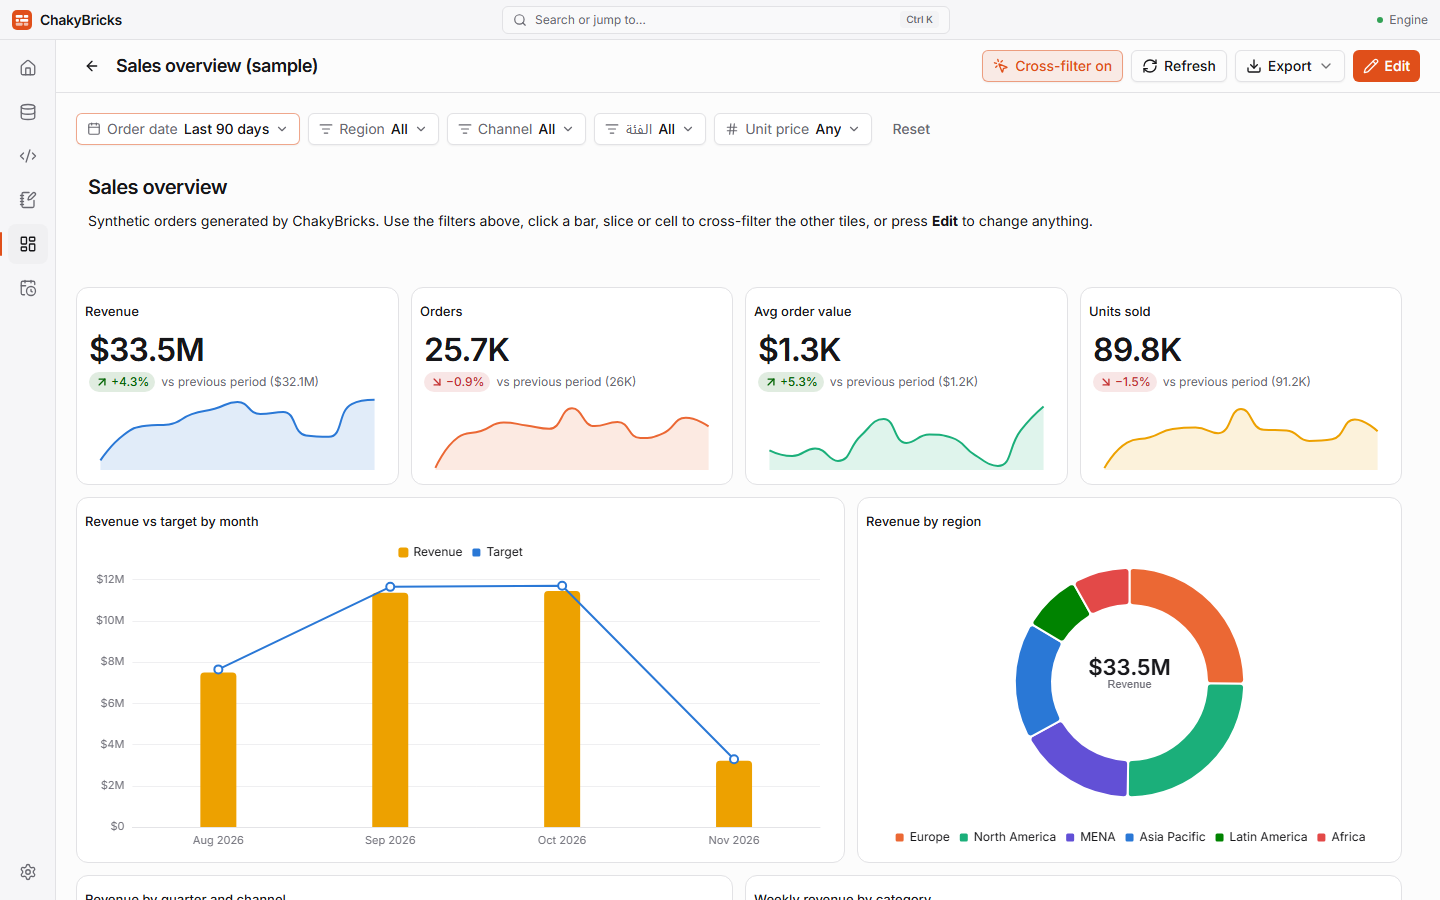
Create a dashboard
- New dashboard creates an empty one: give it a name and start adding tiles.
- Sample dashboard generates a 200,000-row sales table (
main.demo_sales, including an Arabic category column) and a dashboard called Sales overview (sample) with 12 tiles. It is the quickest way to see everything described below.
In the list, each dashboard has Rename…, Duplicate and Delete in its menu.
View mode and edit mode
A dashboard opens in view mode: use the filters, click chart elements to cross-filter, Refresh the data, expand a tile to full size, and Export. Click Edit to change it.
In edit mode you can:
- Add tile and choose Chart, KPI scorecard, Table or Text.
- Drag a tile by its header and resize it from its edges or corner.
- Select a tile to open the tile builder in the right panel; duplicate or delete the tile with the buttons on the tile (the Del key also deletes the selected tile, Esc deselects).
- Open Filters to manage the dashboard's filters, and Style to change the look.
- Save (Ctrl+S) or discard your changes. Leaving with unsaved changes asks first.
Tiles and the tile builder
Every chart, KPI and table tile reads from a data source: a table, or a saved query that is a single SELECT. The builder then offers:
Charts — choose the type: bar, stacked bar, line, area, combo (bars plus lines), pie, donut, scatter or heatmap.
- Dimension — what to group by. For date columns pick a grain: day, week, month, quarter or year.
- Breakdown — an optional second grouping that splits bars or lines into series (a heatmap uses it for its second axis). A breakdown works with one metric on bar, stacked bar, line, area and heatmap charts, with up to 8 series (20 on a heatmap); the rest are left out.
- Metrics — one or more, each with an aggregation (sum, average, count, count distinct, min, max), a label, and a number format (automatic, number, compact such as
1.2Kor3.4M, percent or currency). In a combo chart each metric can be drawn as bars or a line, and optionally on a right-hand axis with its own format. Pie, donut and heatmap charts take exactly one metric; a scatter chart takes two (X and Y). - Sort and limit — order by the dimension or a metric and cap the number of items.
- Display — for example data labels.
- Series colours — colours are assigned from the value itself, so the same region has the same colour in every tile; you can override colours per tile.
KPI scorecard — one big number with an optional comparison to the previous period or the previous year (based on the active date filter) and an optional trend line over a date column.
Table — choose the columns to show, with optional metrics, sorting and a limit. A table tile shows up to the first 1,000 rows.
Text — Markdown for titles, notes and explanations.
Filters
Filters are controls shown above the tiles. The types are:
- Date range — presets such as Today, Last 7/30/90/365 days, This/Last month, This quarter, This/Last year and All time, or a custom range.
- Select — pick values from a column, single or multiple, with a search box.
- Number range — minimum and maximum of a numeric column.
Each filter is tied to a column in a data source and applies to every tile whose source has that column. You can set the current value as the filter's default ("Use current value as default"), and Reset in the filter bar restores the defaults. Filter values are passed to the database as parameters, never pasted into SQL text.
Cross-filtering
Click a bar, slice or heatmap cell to filter the other tiles by it; a chip appears above the dashboard, and clicking the same element again, or the chip's ✕, clears it. ++ctrl+click++ or ++shift+click++ adds to the selection. The Cross-filter on/off toggle in the header switches the feature off: in view mode that is a temporary switch, in edit mode it is saved with the dashboard.
Style and refresh
Style sets the dashboard's colour palette (Classic, Sunset, Lagoon or Twilight), its background (Default, Soft or Contrast) and an auto-refresh interval (off, or every 10 or 30 seconds, 1, 5 or 15 minutes). Light and dark themes are both supported.
Export
Export saves the dashboard as a PNG image or a PDF document through a save dialog. Text in any language, including Arabic, and the charts are included.
Speed
Results are cached per query, filters and table version, so reopening a dashboard or switching a filter back is instant. By default tile queries run one at a time, which keeps memory use low on very large tables — on an 88-million-row table, a 10-tile dashboard loads in about 21 seconds the first time and in about a tenth of a second after that. You can change the number of simultaneous queries in Settings.